UK’s Carbon Footprint

The Government has recently unveiled the annual greenhouse gas and carbon dioxide emissions relating to UK and England.
UK’s Decrease in Carbon Footprint
Between 2019 and 2020, it is estimated that the UK’s carbon footprint has fallen by 13%. The highest carbon footprint recorded from the UK was 959 million tCO2e in 2007, but in 2020 this has decreased by 39%. Similarly, England’s carbon footprint peaked at 804 million tCO2e in 2004, but by 2020 has also fallen by 39%.1
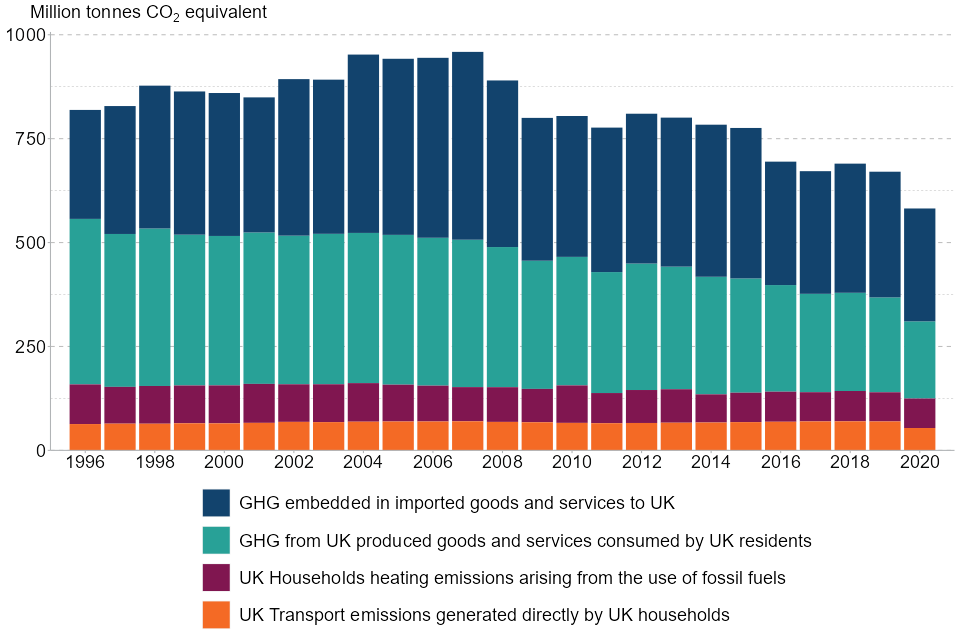
Although these are positive figures, it is important to note that the statistics for the first half of 2020 include the time of lockdown during COVID-19; therefore lowering emissions due to travel restrictions.
Carbon Footprint Explained
Carbon footprint refers to emissions that are associated with energy consumption by UK and English residents, in addition to those directly generated by households.
Total carbon footprint takes into consideration seven (7) key Greenhouse Gases, including:
- Carbon Dioxide (CO2)
- Methane (CH4)
- Nitrous oxide (N2O)
- Hydro-fluorocarbons (HFC)
- Perfluorocarbons (PFC)
- Nitrogen trifluoride (NF3)
- Sulphur hexafluoride (SF6)
This reduction in carbon emissions from the UK can be attributed to changes in a number of aspects: including decreases in transport by UK residents. People are becoming increasingly aware of the effects of climate change, and are opting to use public transport, cycling and walking in a bid to help the planet, with transport emissions decreasing 15% since 1990.2
Importing and Its Effects
The UK economy is now largely made up of the service sector rather than manufacturing, meaning a large proportion of the goods that we buy are produced overseas. Therefore, it is important to take these into account when calculating the country’s carbon footprint. However, these are not easily measured, due to different regulations in different countries. Interestingly, emissions relating to imports from Europe have decreased by 20% from 2004, which is a positive sign that changes are being made in the EU to help fight climate change.
Measuring Carbon Emissions
The UK’s carbon footprint is measured in various ways, including on a territorial and production basis. The territorial basis only measures emissions that occur within the UK’s borders, which are used for reporting on the progress of carbon reduction targets, including net zero emissions.
The production basis, also known as the ‘residence basis’, refers to greenhouse gas emissions produced by UK residents; including UK tourists abroad, aviation and shipping from British operators. These were predicted at 512 million tCO2e in 2022.3 The production basis excludes emissions that can be attributed to overseas residents and industries, including foreign tourists.
Carbon Dioxide Emissions
The Government also reports on the UK’s carbon dioxide footprint, which measures the CO2 alone. CO2 is the main greenhouse gas, and currently accounts for 76% of all UK consumption emissions, and 97% of greenhouse gas emissions generated by UK households.4
Despite these high figures, research shows that the UK’s carbon dioxide footprint had fallen by 14% between 2019 and 2020, with England’s carbon dioxide footprint falling by 12% within the same period.
Efforts to Decrease Carbon
There is still a long way to go; the UK economy continues to increase its efforts to reduce carbon emissions, and there is still much to be done to reach the target of net zero by 2050. However, the figures indicate that we are heading in the right direction.
1 GOV.UK
2 GOV.UK
3 ONS
4 GOV.UK