The Importance of Pressure and Temperature Compensation of Natural Gas Meters
Posted on 9th February 2018
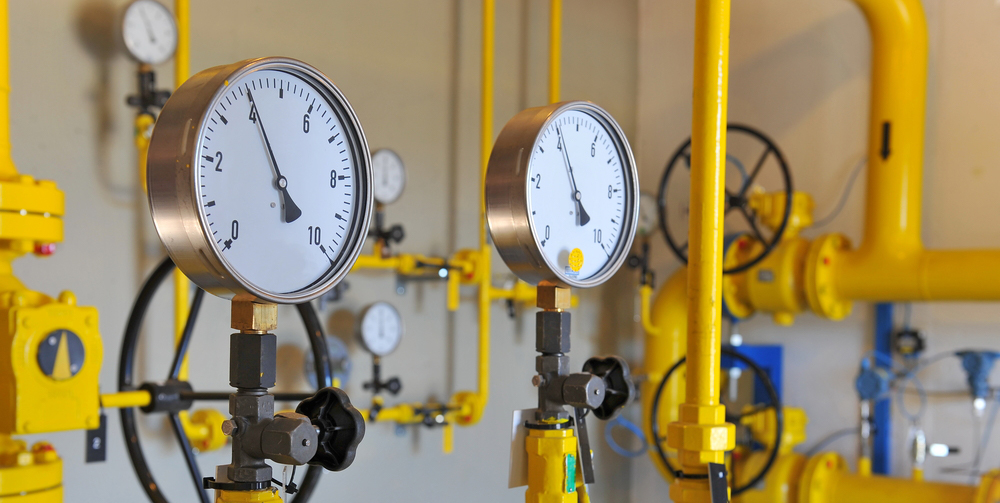
Currently, the volumetric measurement of natural gas, normally in cubic metres (m3), is fairly simple; in fact, most common meters in the United Kingdom are still mechanical devices that accomplish this. It is when converting this volumetric figure to kWh that the effects of differing temperatures and pressures can be seen.
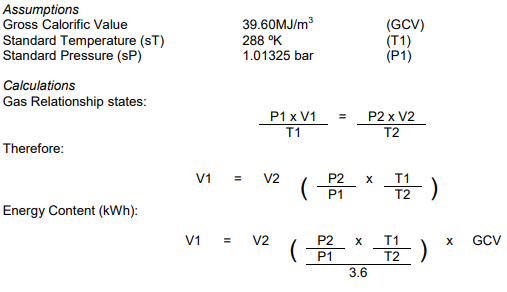
The standard calculation from m3 to kWh is as follows:
Consumption (kWh) = Volume (m3) x Correction Factor x Calorific Value / 3.6
If we assume that the ‘core’ volume is a constant quantity and that the calorific value is also a constant for this exercise; then it is the value of the correction factor that will affect the final consumption in kWh. We should look at how pressure and temperature can affect the correction factor and therefore consumption of natural gas in kWh.
Correction Factor
The correction factor is used to take into account changes in the volume of the gas based on temperature and pressure, which can vary slightly for different supplies. This makes sure all customers receive the same quantity of gas, regardless of location.
Most gas meters measure the volume of gas at existing line conditions of pressure and temperature. The reference volume, or the ‘normal cubic metre’, is often characterised by the abbreviation Nm3. By stating a unit of flow as Nm3, there are two parameters that are critical for the definition of the unit flow. They are the pressure and the temperature. The Nm3 indication means that the cubic metre is given under the conditions of a temperature of 15°C and an absolute pressure of 1.01325bar, i.e. under the normal atmospheric pressure at sea level.
Gas Meter Correction Factor Calculations
Therefore to see the effects of pressure and temperature change, the above calculation is carried out for the recorded minimums and maximums of both pressure and temperature.
| Recorded Data (Temperature) | (ºC) | (ºK) | Symbol |
|---|---|---|---|
| Maximum Recorded Temperature | 16.1 | 289.1 | Tmax |
| Minimum Recorded Temperature | 14.2 | 287.2 | Tmin |
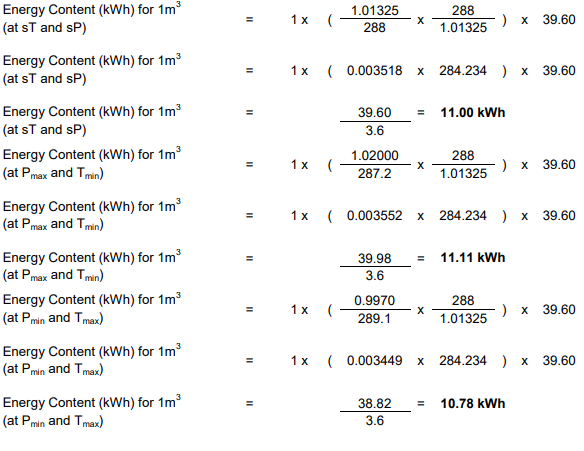
Table 1 – Variations in Energy Content With Changes in Pressure
| Data | Changes in Pressure/Temperature – Paisley – 2017 | |||||||||||
|---|---|---|---|---|---|---|---|---|---|---|---|---|
| Temperature (°C) | 15.00 | 15.00 | 15.00 | 15.00 | 15.00 | 15.00 | 15.00 | 15.00 | 15.00 | 15.00 | ||
| Temperature (°K) | 288.00 | 288.00 | 288.00 | 288.00 | 288.00 | 288.00 | 288.00 | 288.00 | 288.00 | 288.00 | ||
| GCV (MJ/m3 | 39.60 | 39.60 | 39.60 | 39.60 | 39.60 | 39.60 | 39.60 | 39.60 | 39.60 | 39.60 | ||
| Pressure (mbar) | 993.25 | 998.25 | 1003.25 | 1008.25 | 1013.25 | 1018.25 | 1023.25 | 1028.25 | 1033.25 | 1038.25 | ||
| Energy Content: | 10.78 | 10.84 | 10.89 | 10.95 | 11.00 | 11.05 | 11.11 | 11.16 | 11.22 | 11.27 | ||
Table 2 – Variations in Energy Content With Changes in Temperature
| Data | Changes in Temperature (ºC) / Energy Content (kWh) | |||||||||||
|---|---|---|---|---|---|---|---|---|---|---|---|---|
| Temperature (°C) | 10.00 | 11.00 | 12.00 | 13.00 | 14.00 | 15.00 | 16.00 | 17.00 | 18.00 | 19.00 | ||
| Temperature (°K) | 283.00 | 284.00 | 285.00 | 286.00 | 287.00 | 288.00 | 289.00 | 290.00 | 291.00 | 292.00 | ||
| GCV (MJ/m3) | 39.60 | 39.60 | 39.60 | 39.60 | 39.60 | 39.60 | 39.60 | 39.60 | 39.60 | 39.60 | ||
| Pressure (mbar) | 1013.25 | 1013.25 | 1013.25 | 1013.25 | 1013.25 | 1013.25 | 1013.25 | 1013.25 | 1013.25 | 1013.25 | ||
| Energy Content: | 11.19 | 11.15 | 11.12 | 11.08 | 11.04 | 11.00 | 10.96 | 10.92 | 10.89 | 10.85 | ||
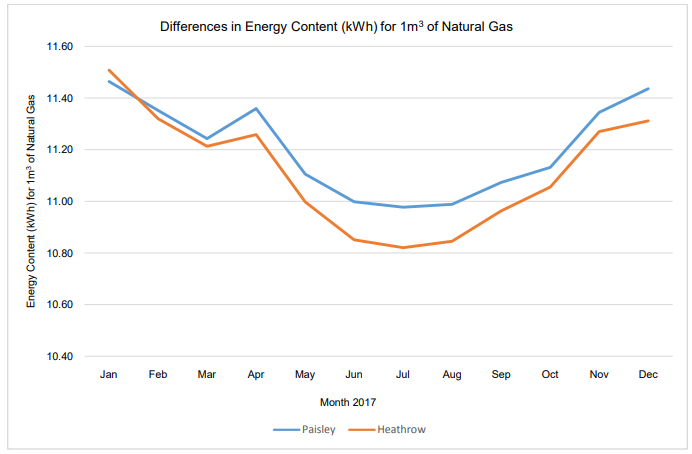
So we can see from this data that, as the pressure increases so does the energy content; conversely, as the temperature increases, the energy content decreases. When we combine the changes in both temperature and pressure we can see the true effect these can have on the energy content of natural gas. By looking at two specific locations in the UK we can see what these effects would have on the energy content and subsequently on the cost of natural gas in those locations.
Table 3 – Variations in Energy Content With Changes in Pressure and Temperature – Paisley – 2017
| Data | Changes in Pressure/Temperature – Paisley – 2017 | |||||||||||
|---|---|---|---|---|---|---|---|---|---|---|---|---|
| Month | Jan | Feb | Mar | Apr | May | Jun | Jul | Aug | Sep | Oct | Nov | Dec |
| Average Temperature (°C) | 5.00 | 5.00 | 8.00 | 8.00 | 13.00 | 14.00 | 15.00 | 15.00 | 12.00 | 11.00 | 6.00 | 6.00 |
| Average Temperature (°K) | 278.00 | 278.00 | 281.00 | 281.00 | 286.00 | 287.00 | 288.00 | 288.00 | 285.00 | 284.00 | 279.00 | 279.00 |
| Average GCV (MJ/m3) | 39.60 | 39.60 | 39.60 | 39.60 | 39.60 | 39.60 | 39.60 | 39.60 | 39.60 | 39.60 | 39.60 | 39.60 |
| Average Pressure (mbar) | 1019.3 | 1009.3 | 1010.4 | 1020.9 | 1015.8 | 1009.5 | 1011.1 | 1012.1 | 1009.3 | 1011.1 | 1012.3 | 1020.5 |
| Energy Content (kWh) | 11.46 | 11.35 | 11.24 | 11.36 | 11.10 | 11.00 | 10.98 | 10.99 | 11.07 | 11.13 | 11.34 | 11.44 |
Table 4 – Variations in energy content with changes in pressure and temperature – Heathrow – 2017
| Data | Changes in Pressure/Temperature – Heathrow – 2017 | |||||||||||
|---|---|---|---|---|---|---|---|---|---|---|---|---|
| Month | Jan | Feb | Mar | Apr | May | Jun | Jul | Aug | Sep | Oct | Nov | Dec |
| Average Temperature (°C) | 5.00 | 7.00 | 10.00 | 11.00 | 16.00 | 19.00 | 20.00 | 20.00 | 16.00 | 15.00 | 9.00 | 7.00 |
| Average Temperature (°K) | 278.00 | 280.00 | 283.00 | 284.00 | 289.00 | 292.00 | 293.00 | 293.00 | 289.00 | 288.00 | 282.00 | 280.00 |
| Average GCV (MJ/m3) | 39.60 | 39.60 | 39.60 | 39.60 | 39.60 | 39.60 | 39.60 | 39.60 | 39.60 | 39.60 | 39.60 | 39.60 |
| Average Pressure (mbar) | 1023.2 | 1013.7 | 1014.9 | 1022.6 | 1016.5 | 1013.4 | 1014.0 | 1016.3 | 1013.3 | 1018.3 | 1016.5 | 1013 |
| Energy Content (kWh) | 11.51 | 11.32 | 11.21 | 11.26 | 11.00 | 10.85 | 10.82 | 10.84 | 10.96 | 11.05 | 11.27 | 11.31 |
The graphs show the differences in energy content based on location and the cost implications if each location used the same volumetric quantity of gas but no pressure and temperature compensation (correction factor) was applied.
Graph 1 – Variations in Energy Content for 1m3 of Natural Gas – Paisley / Heathrow
Graph 2 – Variations in Energy Cost for 100,000 m3 of Natural Gas – Paisley / Heathrow
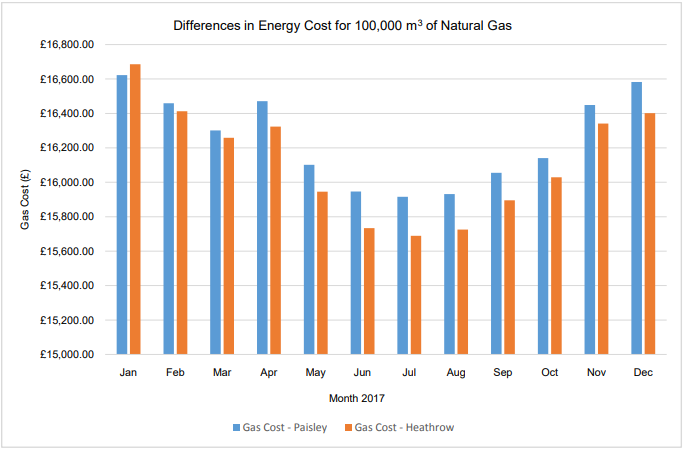
The total gas cost in Paisley would be £194,976.97 for the year; whilst the total gas cost in Heathrow would be £193,443.56, a difference of £1,533.41 for the year.
Thus we can see why it is important that gas meters are pressure and temperature compensated, to avoid overpayment/underpayment for gas and to ensure a level playing field for all consumers.
Note: Pressure and temperature data supplied by the Metrological Office.
2EA® are registered Low Carbon Energy Assessors, Consultants and ESOS Lead Assessors, offering both energy management and reduction services ranging from CCL/CHPQA Management to Energy Saving Opportunity Scheme (ESOS) and Carbon Reduction Commitment (CRC) consultancy.
For more information, please contact us either by email to info@2ea.co.uk or by calling 01293 521 350.
Related posts…